-
 Project Curve Tracer: Visualization Maturing
- Date Thu 26 May 2016
- By Jason Jones
- Category curve-tracer
- Tags curve-tracer c curve tracer python project tkinter
Making Progress on the GUI
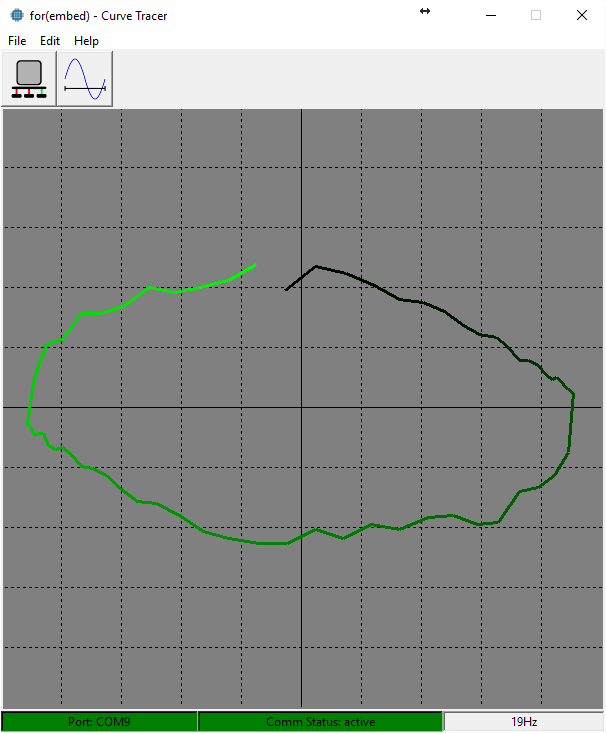
As you can see, the visualization tool is becoming more mature. We have taken the visualization scaffolding developed in the last post and added a few elements to each frame. It is amazing what a few buttons and menus will do for the looks of an application. The visualization still has that 'Tk' look which, though dated, is quite functional.
If you have been following along, you may note that the above is the curve trace of a capacitor and that we are still working on the original hardware. We will be transitioning to the new layout soon. I have received the boards and am half-way through soldering the parts on. I am hoping that the improvements to the analog section will yield a much higher quality of data. We shall see...
Features
What Works
At this point, the GUI may be used to:
- select the port
- change the frequency
- display the currently-selected serial port
- display the communication status
- display the frequency
This list comprises all of the required functionality of the curve tracer, but we would like to add a bit more. In my experience, the demonstrated capability of the current version of the visualization will meet the requirements of 90% of those wishing to use the curve tracer as a troubleshooting tool. When I was using a curve tracer for my job as a technician, this is the mode that I operated in almost constantly.
We Want More!
Despite this, we have a lot of options to improve the tool and all of those options are software-driven at this point... so why not? Specifically, we would like to eventually add support for:
| Feature | Description |
|---|---|
| MOSFET/transistor mode | This mode is for analysis of a MOSFET or transistor forward curve based on the gate/base voltage/current |
| Take Screenshots | Ability to take screenshots and save them in a common format (PNG, GIF, etc.) |
| Recall Screenshots | Ability to recall screenshots |
| CSV | Save curve data to a CSV file |
| Recall/compare | Recall data from CSV to be displayed and compared to live traces |
| Scan mode | Scan through a low frequency to a higher frequency to highlight reactive components |
Additional Screenshots
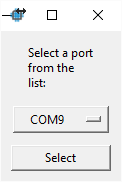
Port Selection Window
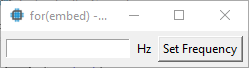
Frequency Setting Window
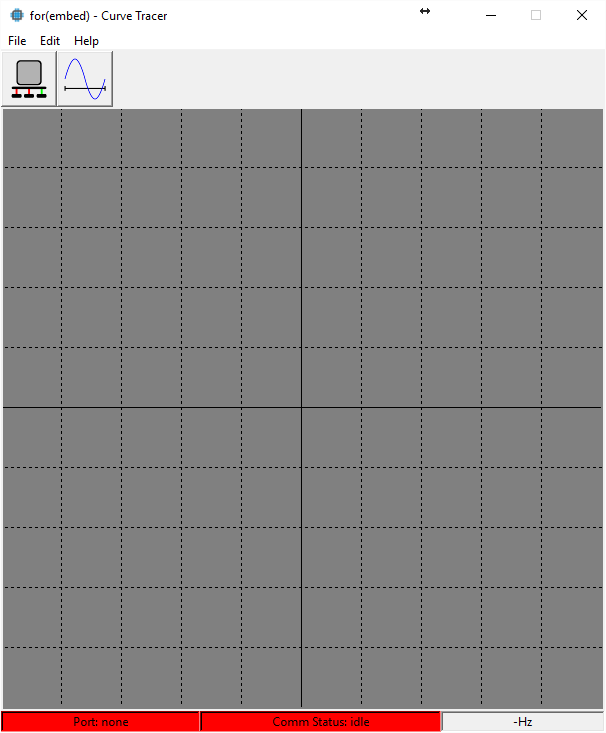
Inactive Window
When the software is started and the ports are not selected nor connected.
- article
- current-sensor
- curve-tracer
- dispatch
- fan-controller
- fixed-point-math
- load-cell-sensor
- meta
- reference


 RSS
RSS
2
assembly
5
buffer
31
c
3
current sensor
28
curve tracer
2
fan controller
6
fixed-point math
4
interrupt
3
KiCAD
3
labview
5
layout
6
msp430
4
pelican
18
pic24
29
project
12
python
2
Q1.15
4
schematic
10
serial
3
solidworks
2
task manager
2
theme
3
tkinter
9
uart
9
xc16